Imagine a school teacher who checks the test scores of all students in the class. The teacher wants to know how much the scores vary from the average. In statistics, this spread is called standard deviation. In spreadsheet tools like Microsoft Excel, users often calculate this spread using formulas. Two common formulas are STDEV.P and STDEV.S.
The difference between STDEV.P and STDEV.S becomes important when working with large data or small samples. Many professionals use spreadsheets daily, so knowing the difference between STDEV.P and STDEV.S improves data accuracy.
In simple terms, the difference between STDEV.P and STDEV.S depends on whether we use the whole data set or only a sample.
In this guide, we will explain the difference between STDEV.P and STDEV.S in a simple and clear way.
Pronunciation of Both Terms
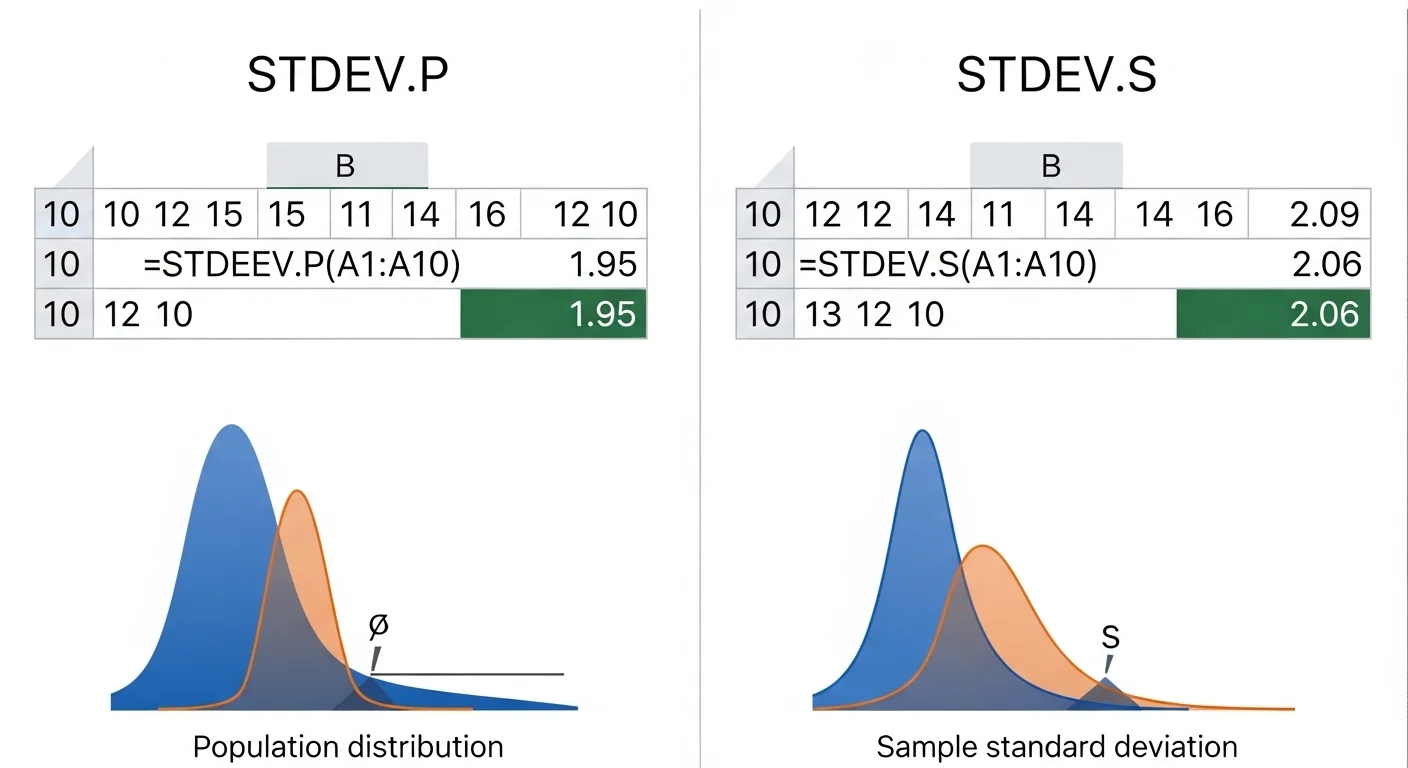
STDEV.P
- US pronunciation: es-tee-dev dot pee
- UK pronunciation: es-tee-dev dot pee
STDEV.S
- US pronunciation: es-tee-dev dot ess
- UK pronunciation: es-tee-dev dot ess
Before we explore the technical details, let us look closely at how these two formulas differ.
A List of 10 Differences between STDEV.P and STDEV.S
1. Population vs Sample
- STDEV.P calculates deviation for the entire population.
- STDEV.S calculates deviation for a sample taken from a larger population.
🟣 Example 1:
A company analyzes the salary of all employees using STDEV.P.
🟣 Example 2:
A researcher studies 20 workers out of 500 employees using STDEV.S.
2. Data Coverage
- STDEV.P uses the whole dataset.
- STDEV.S uses only part of the dataset.
🟣 Example 1:
A teacher calculates the deviation of scores of all 40 students using STDEV.P.
🟣 Example 2:
A teacher studies scores of only 10 students using STDEV.S.
3. Formula Adjustment
- STDEV.P divides by N (total number of values).
- STDEV.S divides by N-1.
🟣 Example 1:
If data values are 5 numbers, STDEV.P divides by 5.
🟣 Example 2:
With the same data, STDEV.S divides by 4.
4. Accuracy for Small Data
- STDEV.P works best with complete data.
- STDEV.S adjusts results for small samples.
🟣 Example 1:
Population statistics use STDEV.P.
🟣 Example 2:
Research surveys often use STDEV.S.
5. Statistical Purpose
- STDEV.P measures exact population variability.
- STDEV.S estimates population variability from a sample.
🟣 Example 1:
A census dataset uses STDEV.P.
🟣 Example 2:
A market survey uses STDEV.S.
6. Bias Correction
- STDEV.P has no sample bias correction.
- STDEV.S corrects sample bias.
🟣 Example 1:
Full dataset analysis uses STDEV.P.
🟣 Example 2:
Scientific experiments use STDEV.S.
7. Usage in Research
- STDEV.P appears in complete statistical datasets.
- STDEV.S appears more in experiments and studies.
🟣 Example 1:
Government population reports may use STDEV.P.
🟣 Example 2:
Academic research papers often use STDEV.S.
8. Excel Formula Purpose
- STDEV.P replaces the older formula STDEVP.
- STDEV.S replaces the older formula STDEV.
🟣 Example 1:
Modern spreadsheets use STDEV.P for populations.
🟣 Example 2:
Modern spreadsheets use STDEV.S for samples.
9. Result Size
- STDEV.S often gives a slightly larger value.
- STDEV.P usually gives a slightly smaller value.
🟣 Example 1:
Sample data may show larger deviation with STDEV.S.
🟣 Example 2:
Complete data may show smaller deviation with STDEV.P.
10. Data Decision Context
- STDEV.P fits controlled datasets.
- STDEV.S fits predictive analysis.
🟣 Example 1:
A full sales database uses STDEV.P.
🟣 Example 2:
Market predictions from survey data use STDEV.S.
Nature and Behaviour of Both
STDEV.P
This formula behaves as a population measure. It assumes that all values are included. The calculation is direct and exact.
STDEV.S
This formula behaves as a sample estimator. It assumes the dataset is only a portion of a larger population. The formula adjusts the calculation to reduce bias.
Why Are People Confused About Their Use?
Many people see both formulas in spreadsheet tools like Microsoft Excel and think they do the same job. The names are also very similar. Beginners may not know the difference between population data and sample data. Because of this, they may choose the wrong formula. Learning when to use each function solves this confusion.
Table Showing Difference and Similarity
| Feature | STDEV.P | STDEV.S | Similarity |
| Data type | Population | Sample | Both measure standard deviation |
| Formula division | N | N-1 | Both use variance calculation |
| Result | Slightly smaller | Slightly larger | Both show spread of data |
| Usage | Complete dataset | Partial dataset | Both used in statistics |
| Tool | Spreadsheet formulas | Spreadsheet formulas | Both common in Excel |
Which Is Better in What Situation?
STDEV.P is better when you have complete data. For example, if a company records the salary of every employee, it should use STDEV.P. The formula measures the exact spread of the entire dataset. In such cases, no estimation is needed.
STDEV.S works better when you only have sample data. Researchers often collect data from a small group instead of the whole population. STDEV.S corrects the calculation and gives a better estimate. This makes it useful for research, surveys, and statistical studies.
How Are the Keywords Used in Metaphors and Similes?
🟣 “Data spread like STDEV.P, showing the full picture.”
🟣 “The survey result worked like STDEV.S, giving only an estimate of the bigger reality.”
🟣 “Their performance varied like numbers in a standard deviation chart.”
Connotative Meaning of Both Keywords
🟣 STDEV.P (Neutral / Technical)
Example: Analysts used STDEV.P to study the variation in all company sales.
🟣 STDEV.S (Neutral / Analytical)
Example: Researchers used STDEV.S to estimate trends from survey data.
Idioms or Proverbs Related to the Words
These formulas are technical, so there are no direct idioms. However, related expressions exist.
🟣 “Numbers tell the story.”
Example: The analyst said, “Numbers tell the story when we calculate deviation.”
🟣 “Look at the bigger picture.”
Example: Using population data helps us look at the bigger picture.
Works in Literature Mentioning the Keywords
These exact technical terms rarely appear in literature, but statistics often appear in academic writing.
🟣 Statistics — Academic Textbook, David Freedman, 2007
🟣 The Signal and the Noise — Nonfiction, Nate Silver, 2012
Movies Related to Data and Statistics
🟣 Moneyball — 2011, USA
🟣 The Big Short — 2015, USA
Frequently Asked Questions
1. What is the main difference between STDEV.P and STDEV.S?
STDEV.P uses full population data, while STDEV.S uses sample data.
2. Which formula should beginners use?
Use STDEV.P for complete datasets and STDEV.S for sample datasets.
3. Why does STDEV.S divide by N-1?
It corrects bias when using sample data.
4. Are both formulas available in Excel?
Yes, both functions are built into Microsoft Excel.
5. Do both formulas measure variability?
Yes, both measure how spread out numbers are from the average.
How Are Both Useful for Surroundings?
Both formulas help people understand patterns in real life. Businesses use them to analyze sales data. Schools use them to review student performance. Scientists use them to study experiments. Governments use them to understand population trends. When people measure variation correctly, they can make better decisions for society.
Final Words for Both
STDEV.P and STDEV.S are simple yet powerful tools for data analysis. They help users understand how numbers vary. The only key difference is whether the data represents a population or a sample.
Conclusion
The difference between STDEV.P and STDEV.S is small but very important. Both formulas measure standard deviation, which shows how data spreads around the average. However, STDEV.P works with the entire population dataset, while STDEV.S works with a sample of data. Using the correct formula ensures accurate results. Students, researchers, analysts, and business professionals rely on these formulas to understand numbers better. Once users know the difference, they can analyze data with confidence. In simple terms, choose STDEV.P for full data and STDEV.S for sample data. This small choice leads to better statistical insight and smarter decisions.

Hi! I am Arshad Ullah presently working as linguist in Punjab Education Department. I have done MA in English Literature while M.Phil in Applied Linguistics. I have taught creative writing to the post graduation classes for 15 years. Presently I am working as content writer, and offering classes for blog writing.